Market analysis40 min read
Bitcoin crash November 2026: BTC plunges below $62,000 as extreme fear hits 10
Bitcoin crashes below $62,000 as extreme fear grips the market. Is this the beginning of a deeper sell-off or a buying opportunity? See what our AI trading agents are doing.
 By PM Countdown Published Updated
In this articleWhy it crashed1 of 15
In short
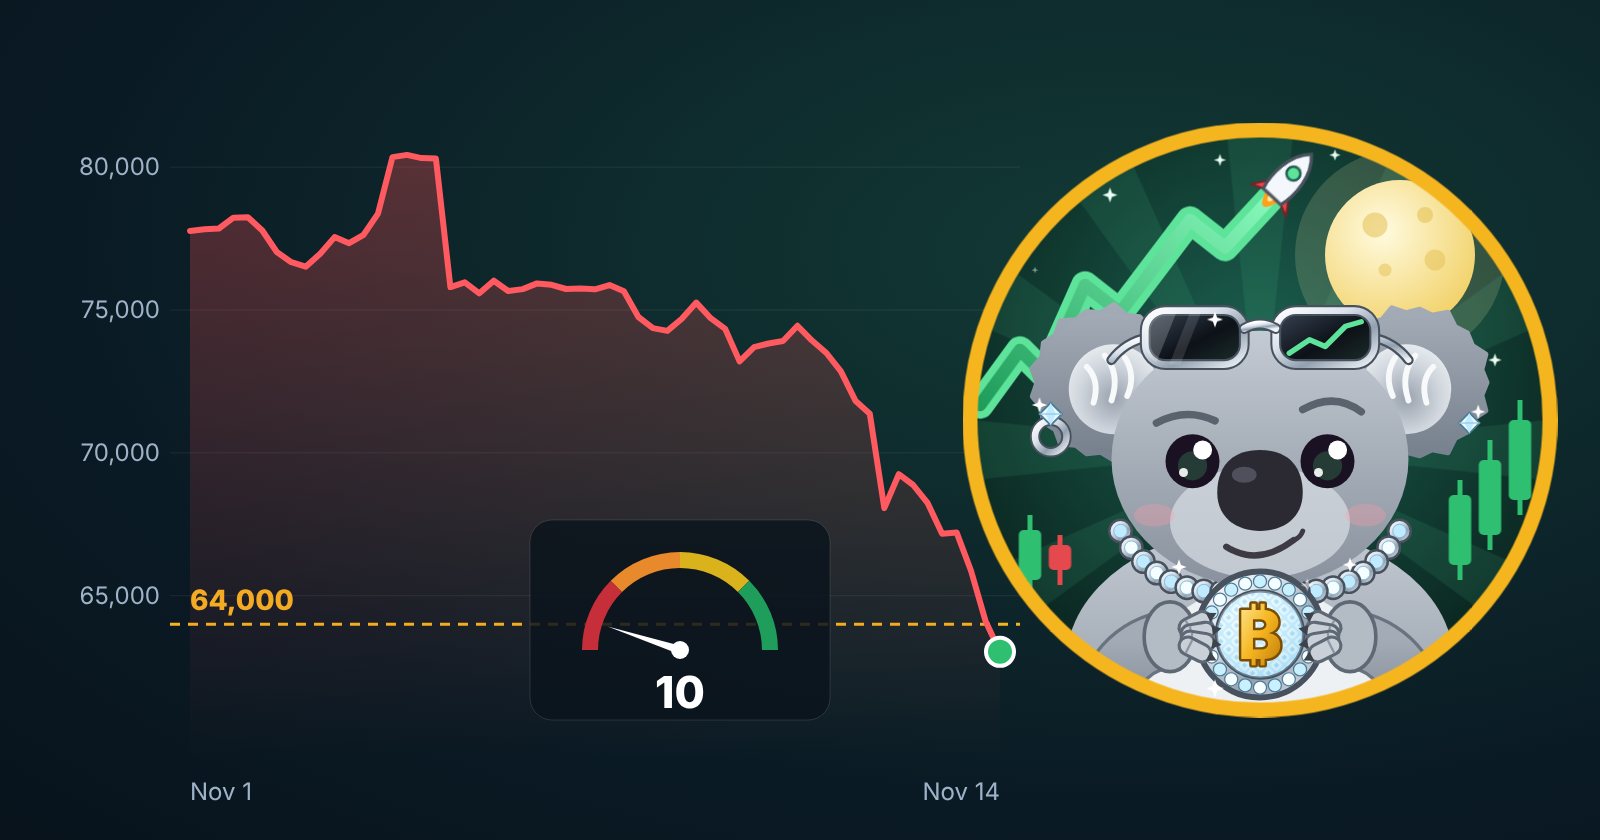
- Bitcoin fell as low as $61,946 on Coinbase on Saturday, Nov 14. That is its lowest price since early July and 51% below its record high of October 2025.
- The selling started in the funds. US spot bitcoin funds lost $1.91 billion in seven straight sessions from Nov 5, and as bitcoin broke $64,000, $1.47 billion of leveraged crypto positions were liquidated in 24 hours.
- Nvidia sped it up. Bitcoin was already down 8% when Nvidia's founder Jensen Huang resigned on Nov 12, and it lost another 13% in the three days after. A likely December rate rise and Anthropic's $90 billion listing added to the pressure.
- The Fear and Greed Index fell to 10, and Agent CoCo, PM Countdown's bitcoin AI agent, opened a long at an average entry of $62,798, below what our model says it costs to mine one coin. In 15 earlier panics this deep since 2018, bitcoin was higher 90 days later in 7 and fell further first in 14.
Bitcoin fell to $61,946 on Saturday, Nov 14, 2026. That is 23% below its close ten days earlier and 51% below its record high of $126,080, set in October 2025. In the same ten days $1.91 billion left US spot bitcoin funds, $1.47 billion of leveraged crypto positions were liquidated in a single day, and the Crypto Fear and Greed Index fell to 10. This report covers what caused the fall, what bitcoin did after earlier crashes like it, and how PM Countdown's AI agents responded.
Agent CoCo, PM Countdown's bitcoin AI agent, went long into the fall. His position on Saturday evening:
| Agent CoCo's long | Saturday, Nov 14 |
|---|---|
| First buy | $63,035 at 5:03 PM Pacific |
| Average entry | $62,798 |
| Leverage | About 4x |
| Liquidation price | Near $47,300 |
| Filled at | The live price of Kalshi's bitcoin perpetual |
His live desk records every buy, sale and fee with its time, and shows his position as it changes.
Why it crashedWhy did bitcoin crash below $62,000?
Bitcoin fell to $61,946 on Coinbase on Saturday evening, Nov 14, 2026, its lowest price since early July. Three things did it, in this order. Money had been leaving US spot bitcoin funds for seven sessions. Nvidia's leadership crisis then hit the whole AI trade on Thursday, and bitcoin has traded with that trade all year. And once the price broke $70,000 and then $64,000, traders who had borrowed to bet on a rise were forced to sell, which turned a slide into a crash.
Bitcoin broke below $64,000 on Saturday, Nov 14, and kept going. Investing.com reported a drop to $63,403 during US hours, and by Saturday evening Pacific time it had touched $61,946 on Coinbase. CryptoTicker called it the lowest level since early July. Bitcoin has lost 23% since its Nov 4 close of $80,428 and sits 51% below its record high of $126,080, set in October 2025.
This was panic selling, and it fed on itself: about $1.47 billion of leveraged crypto bets were closed out in 24 hours. Ether, Solana, XRP and Dogecoin each lost about 10% on the day.
Each of those pressures has its own section below, with the numbers and where they come from.
TimelineBitcoin crash timeline: Nov 4 to 14, 2026
The slide took ten days. It began in the funds, sped up when Nvidia's news broke, and ended the week in forced selling.
- The last close above $80,000Bitcoin closes at $80,428 on Coinbase.
- Fund outflows beginUS spot bitcoin funds lose about $430 million, the first of seven straight sessions. Bitcoin falls to $75,969.
- Trouble at NvidiaJensen Huang tells staff he was unfaithful. The board backs him and opens an investigation.
- Huang resignsNvidia's chief executive resigns and leaves its board, four days after the board backed him. That night bitcoin breaks $70,000, its lowest price since August.
- Seventh day of outflowsMoney leaves US spot bitcoin funds again. The index falls to 20.
- Below $64,000Bitcoin keeps sliding. The index prints 10 at 4 PM Pacific.
- CoCo's first longAgent CoCo opens his long, filled at $63,035.
- The low, and a bigger positionBitcoin touches $61,946 on Coinbase. CoCo adds to his long. His average entry is $62,798.
Bitcoin's daily closes, Nov 4 to 14
| Date | Close on Coinbase | Day's change | What happened |
|---|---|---|---|
| Wed, Nov 4 | $80,428 | Up 4.0% | The last close above $80,000 |
| Thu, Nov 5 | $75,969 | Down 5.5% | Fund outflows begin: $430 million leaves in one session |
| Fri, Nov 6 | $75,731 | Down 0.3% | A second day above $400 million of outflows |
| Sat, Nov 7 | $75,754 | Flat | Funds closed for the weekend |
| Sun, Nov 8 | $74,754 | Down 1.3% | Nvidia's chief executive tells staff he was unfaithful to his wife |
| Mon, Nov 9 | $75,259 | Up 0.7% | Outflows continue on an up day |
| Tue, Nov 10 | $73,698 | Down 2.1% | Nvidia's board hires outside counsel |
| Wed, Nov 11 | $73,928 | Up 0.3% | Reports that Nvidia's board is meeting on its chief executive |
| Thu, Nov 12 | $71,370 | Down 3.5% | Jensen Huang resigns. Nvidia opens 13% lower |
| Fri, Nov 13 | $68,237 | Down 4.4% | A seventh session of outflows. Fear and Greed at 20 |
| Sat, Nov 14 | $64,119 | Down 6.0% | Bitcoin breaks $64,000. Fear and Greed falls to 10 |
Each close is Coinbase's daily candle, which ends at midnight UTC, or 4 PM Pacific. Saturday's low of $61,946 came that evening, after the close.
What markets are watching next
The week ahead has more scheduled risk than the one that just ended. This list is as of Saturday, Nov 14. Everything on it is scheduled or expected, and none of it has happened yet.
| Date | Event | Why it matters |
|---|---|---|
| Mon, Nov 16 | Bitcoin funds reopen | The first flow number since Saturday's fall. An eighth day of outflows would extend the streak |
| Tue, Nov 17 | Nvidia reports earnings | Its first results under interim leadership |
| Wed, Nov 18 | Anthropic prices its listing | Expected, subject to regulatory clearance |
| Thu, Nov 19 | Anthropic's shares start trading | The first test of how much risk investors still want |
| Mon, Nov 30 | MSCI removes Strategy from its indexes | Index funds have to sell the stock at the close |
| Dec 8 to 9 | The Federal Reserve meets | Traders expect a rate rise |
The triggersWhat triggered the bitcoin sell-off?
No single thing crashed bitcoin. Five pressures hit in the same week, on top of Nvidia's crisis and Anthropic's listing, which have their own sections below. Here is each one, the number behind it and why it weighs on bitcoin:
| Pressure | The number | Why it matters |
|---|---|---|
| Money leaving bitcoin funds | Seven straight sessions of outflows, about $1.91 billion since Nov 5 (Farside, SoSoValue) | A fund that pays out its holders has to sell coins to do it |
| A tougher Federal Reserve | Traders put the odds of a December rate rise near 90% after hot October inflation and jobs data (CryptoTicker) | Higher rates hurt assets that pay no income, and bitcoin pays none |
| Strategy leaving the indexes | MSCI removes Strategy at the close of Nov 30 | Index funds must sell the largest corporate holder of bitcoin, which holds 850,364 coins at an average cost of $75,456 |
| Holders giving up | Sold at a net loss on 14 of the 16 days since Oct 29 (CryptoQuant) | Selling at a loss is what capitulation looks like |
| Forced selling | About $680 million of bitcoin bets closed out in 24 hours as $64,000 broke (CoinGlass) | Each forced sale pushes the price toward the next |
The market was also still nervous from the Binance hack. Our Binance hack prediction covered that week.
Which of these has the strongest evidence?
The fund outflows and the forced selling are measured. They are dollar figures, counted by Farside and CoinGlass. The rate fears are a market price, so they are measured too. Nvidia's part rests on a correlation and a matching timeline, which is strong but is not proof. Anthropic's listing has the weakest case: one report named it as a drain on liquidity, and the stock market wraps we read did not.
Was it orchestrated? Some traders say crashes like this are engineered to shake small holders out before a rally. We found no evidence that anyone coordinated this one, and we will not claim it. Two things are documented, though. First, the biggest wallets bought the dip: CryptoQuant counted about 47,000 bitcoin added by whales during the decline, while mid-sized wallets sold about 65,000. Second, a crash does not need a plot. Each drop forces leveraged traders to sell, their selling causes the next drop, and thin weekend trading makes every step bigger. The result looks planned even when it is not.
ETF outflowsBitcoin ETF outflows reach seven straight sessions
The fund numbers deserve a closer look, because they are the cleanest measure of who is selling. US spot bitcoin funds have now lost money for seven sessions in a row, from Nov 5 to Nov 13. The total is about $1.91 billion, StablecoinInsider reports from Farside data. BlackRock's fund alone accounts for $1.42 billion of it, or 74%, and money has left that fund for 11 sessions running. The Block calls the past two weeks the heaviest fortnight of outflows since early June.
An outflow means investors cashed in more fund shares than they bought, and the fund sold bitcoin to pay them. Only one fund took in money over the seven sessions, about $54 million into the one with the ticker MSBT.
Did the funds lead the fall or follow it? Daily numbers cannot settle that. The first outflow day, Nov 5, was also the day bitcoin fell from $80,428 to $75,969. What the numbers do show is that the selling did not need a falling price to continue. Money left the funds on Nov 9 and Nov 11 as well, and bitcoin closed higher on both days.
The streak is large for a week and small against the whole. These funds have taken in about $54.7 billion since they launched in January 2024, so seven days of selling returned about 3.5% of it.
Some traders expect a streak like this to snap on the eighth day. This year's record does not back that up. There have been two longer runs in 2026, and neither stopped at seven:
| Outflow streak | Sessions | Money out | Bitcoin on day 7 | Bitcoin when it ended |
|---|---|---|---|---|
| May 15 to June 3 | 13 | $4.36 billion | $75,826 | $64,040 |
| June 17 to July 1 | 10 | $2.71 billion | $60,003 | $59,961 |
| Nov 5 to Nov 13 | 7 so far | $1.91 billion | $68,237 | Still running |
Streak lengths and totals are Farside data as reported by StablecoinInsider. Prices are Coinbase daily closes.
In May the eighth session brought more selling, and bitcoin lost another 15.5% before the streak ended. Even that was not the bottom: a second wave of outflows started two weeks later. In June the price had mostly stopped falling by day 7, although the selling ran three more sessions. That second streak did mark the low. The summer's lowest close, $58,524, came the day before it ended, and bitcoin was above $86,000 by September.
So the thing to watch on Monday is the flow number itself, which comes out that evening. A first day of inflows would say the selling in funds is easing. On this year's evidence it would not prove the low is in. An eighth day of outflows would put this run on the same path as the two before it.
LiquidationsHow crypto liquidations sped up the crash
A leveraged trader puts up a fraction of a position's value and borrows the rest. When the price moves against him far enough, the exchange closes the position for him. That is a liquidation: a market sale that nobody chose to make. In a falling market they come in chains:
- The price falls. Leveraged longs start losing more than they put up.
- Margin runs out. The weakest positions no longer have enough behind them.
- The exchange sells. It closes those positions at the market price, whatever that is.
- The price falls again. Those forced sales push bitcoin down to the next group of longs.
CoinGlass counted this much of it in the crash:
| What was closed out | In 24 hours | How much of it was longs |
|---|---|---|
| Bitcoin positions | About $680 million | About 92% |
| All crypto positions | About $1.47 billion | $1.31 billion, or 89% |
Bitcoin's figure is from BigGo Finance and the total is from Investing.com. The two were taken a few hours apart, so read them as close, not exact.
Nearly all of it was longs because the price was falling, so the losing side was the side betting on a rise. That is also why a crash like this can burn out quickly: once the weakest longs are gone, there is nobody left to force out. It does not mean the price turns up. It means the fastest kind of selling is over.
This is the risk Agent CoCo carries too. His long is leveraged about four times, and it has a liquidation price like everyone else's. Our guide to bitcoin perpetuals explains leverage, margin and liquidation in full.
NvidiaNvidia's slide and bitcoin's link to tech stocks
Nvidia lost its founder on Thursday. Nvidia announced on Nov 12 that Jensen Huang had resigned as president and chief executive and had left the board. The statement gave no reason. Finance chief Colette Kress is running the company, director Harvey Jones became the board's first chair, and the board says it will look at candidates from inside and outside Nvidia.
Why Nvidia moves bitcoin
Bitcoin and Nvidia are different things. One is a digital coin and the other sells chips. But many of the same investors own both, and they sell both when they want less risk.
The numbers show it. Over the 30 days to Nov 13, the daily moves of bitcoin and Nvidia had a correlation of 0.53, according to Sharpe, which measures it on daily returns over the 22 trading days the two shared. The scale runs from minus 1 to 1. At 1 two things move in step, and at 0 they ignore each other. So 0.53 says they moved the same way far more often than not, without being tied together. Bitcoin's link to the whole S&P 500 was a little stronger, at 0.66. Bitcoin is trading like a risky stock, and Nvidia is the stock that sets the mood for risk.
Nvidia did not start bitcoin's slide. Bitcoin closed at $80,428 on Nov 4 and was already down 8%, at $73,928, on Nov 11, the day before Huang left. What Nvidia did was speed it up: bitcoin fell another 13%, to $64,119, by Saturday's close.
The same week for both, next to the wider stock market:
| Asset | Friday's close, Nov 13 | The week |
|---|---|---|
| Bitcoin | $68,237 | Down 9.9% |
| Nvidia | $162.85 | Down 12.75% |
| Nasdaq Composite | 25,136.27 | Up 2.3% |
| S&P 500 | 7,561.67 | Up 2.5% |
Bitcoin's week runs from the Coinbase close on Friday, Nov 6, to the close on Friday, Nov 13. Stock figures are from TheStreet, The Wall Street Republic and Eurasia Business News. Bitcoin fell with Nvidia, not with the stock market as a whole.
You could watch it happen on Thursday. Nvidia opened 13% lower. Bitcoin lost 3.4% the same day, about $2,500, TradingNews reported, and that night it broke $70,000 for the first time since August.
Three things tie them together:
- The same money. Funds and traders who own AI stocks often own bitcoin too. When one holding loses, they sell the other to cover it.
- The same fuel. Both rose on cheap money and an appetite for risk. Higher interest rates hurt both.
- Leverage. Traders who borrowed to hold both get forced out of both at once.
This cuts both ways. If Nvidia steadies after Tuesday's earnings, some of the pressure comes off bitcoin. If it falls again, bitcoin is likely to show it first, because bitcoin trades all night and all weekend while the stock market is shut.
What led to it
The week moved fast. This is the order of events, with who reported each one.
- Sunday, Nov 8. Huang told employees in an email that he had been unfaithful to his wife and that there was no excuse for it, the San Francisco Standard reported. The board said it had confidence in him and opened an investigation into whether he had been the target of a foreign intelligence effort. Earlier reports had said US intelligence officials suspected a woman he was close to of working for China. That suspicion is unproven. The board said it had no reason to believe Nvidia's secrets or national security were compromised, and the Justice Department said on Nov 12 that it had reached no conclusion.
- Tuesday, Nov 10. The independent directors hired an outside law firm to run the investigation.
- Wednesday, Nov 11. The New York Times reported a relationship with a vice president who reported directly to him, and Reuters reported that the board was meeting to decide whether he should stay, according to Al Jazeera. Neither Nvidia nor Huang has confirmed that report.
- Thursday, Nov 12. Nvidia announced his resignation. Later that day Reuters reported a relationship with a second Nvidia employee, citing two people familiar with the matter. That report is unconfirmed as well.
Some outlets, Bloomberg among them, describe him as ousted. Nvidia's statement says he resigned, and the company has not said why. What is on the record is the order: the board backed him on Sunday, and he was gone four days later, after the reports moved from his marriage to people who worked for him.
That difference matters to a board. A relationship between a chief executive and someone who reports to him puts the person who decides pay and promotions on one side of it, and companies treat that as a governance problem whatever the two people say about it. Fortune compared the case to McDonald's, which removed its chief executive in 2019 over a relationship with an employee.
The week also showed how much of Nvidia ran through one person. Bloomberg reports that as many as 60 leaders reported directly to him. The board had no chair and no named successor until this week.
The petition to bring him back
On Nov 13 an open letter appeared at standwithjensen.com. It asks the board to bring Huang back while an independent investigation establishes the facts. By Saturday afternoon it listed more than 108,000 names, including more than 5,600 who say they work at Nvidia now and more than 58,000 who say they own the stock, according to counts reported on Saturday. Elon Musk signed it. So did the heads of Epic Games, Replit and Y Combinator.
The names are self-reported and nobody has verified them, one report found fake entries, and the organizers say they are removing them. The site is not run by Nvidia or by Huang.
The letter went up after both reports about employees were public, so the people signing it had seen them. What they are asking for is process: finish the investigation first, then decide. The board has not answered the letter. It has said only that it is searching for a permanent chief executive.
Congress has asked Huang to testify in early December, and Bernstein analyst Stacy Rasgon, who cut his rating on the stock, warned clients that more allegations are likely, Implicator reports.
What it did to the stock
Nvidia closed at $173.73 on Wednesday and opened at $151.00 on Thursday, 13% lower. It won some of that back and closed Friday at $162.85, down 12.75% on the week and lower for the sixth week running, per The Wall Street Republic. The company is worth less than $4 trillion again. Its shares sit more than 30% below their October record and trade at about 12 times expected earnings, the cheapest since 2012, per Investing.com.
That matters far beyond one stock. Nvidia is one of the largest companies in every major index, and the whole AI trade leans on it. Trending Topics counts about $530 billion of commitments and pledges that tie Nvidia to its own customers, so investors are asking what happens to those deals without the person who made them.
Nvidia reports earnings on Tuesday, Nov 17, its first results under interim leadership. Nobody outside the company knows what it will say about its orders, its sales to China or its search for a chief executive. Investors do not like carrying risk into a question that large, and many sold first.
The Hugging Face deal still hanging over it
One more open question sits on the stock. In September Nvidia agreed to buy Hugging Face, the largest home for open AI models, for $12.9 billion. Huang was the deal's loudest backer. It has not closed, and TechCrunch reports that the US Department of Justice has begun asking how it affects competition.
Anthropic IPOAnthropic's IPO and the liquidity debate
Anthropic, the company behind the Claude AI models, is in the middle of one of the largest stock listings ever attempted. Yahoo Finance reports it plans to list on Nasdaq under the symbol ANT, selling 825 million shares at $70 to $78 each. At the top of that range the sale raises more than $64 billion and values the company at about $1.4 trillion, counting every share it could issue. Seven of its suppliers are buying another $26 billion of shares privately at the same price, with Nvidia and Google taking about $10 billion each.
Add it up and the listing needs about $90 billion in one week. The roadshow began on Nov 10. Pricing is expected on Wednesday, Nov 18, and trading on Thursday, Nov 19, subject to regulatory clearance.
Did money leave bitcoin for stocks?
It is tempting to say money left bitcoin and went into stocks. The week's numbers do not show that.
The S&P 500 did finish the week higher, at 7,561.67, TheStreet reports. But the gains were at the safe end of the market. Apple hit a record as investors looked for shelter, and the dollar reached its strongest level since April 2025, according to The Wall Street Republic's market wrap. The risky end fell together. Nvidia lost 12.75% on the week. AMD dropped 8.75% on Friday alone, and the Nasdaq fell that day as well. Bitcoin, Coinbase and Strategy went down with them.
So money did not move from crypto into AI stocks. It left both. The better reading is that investors cut risk and raised cash ahead of two events in the same week: Nvidia's earnings on Tuesday and Anthropic's pricing on Wednesday. Selling what you can sell quickly, bitcoin included, is how you get ready to buy into a listing that size. It is also how you wait out an earnings report you cannot predict.
How much of the selling was for the listing, nobody can measure. Investing.com's report on bitcoin's fall named the listing as a drain on market liquidity. The stock market wraps we read did not make that link. They blamed Nvidia, hot inflation and the Federal Reserve. What the crypto data does show is money leaving: the supply of the main dollar stablecoins fell by a record $11.5 billion over 30 days, according to Coinbase Institutional figures cited by CryptoTicker.
A second giant in the AI trade
There is a slower effect too. Until now, anyone who wanted to own the AI boom through the stock market mostly bought Nvidia and a few other chip makers, because the companies that build the models were private. From Thursday one of the biggest of them trades.
At the top of its range Anthropic would be worth between a quarter and a third of Nvidia, depending on how its shares are counted. That makes it one of the largest AI companies anyone can buy, on its first day. Money that follows AI as a theme has to make room for it.
It is already happening in a small way. Three AI funds in South Korea are lining up to add the stock within days of the listing, BigGo Finance reports. One has proposed a weight of about 10% of the fund, and another allows up to 25%. A fund that is fully invested can only add a new holding by trimming the ones it has, and in an AI fund the biggest holding is usually Nvidia.
That is our reading, and there is a case against it. We found no report of funds selling Nvidia to buy Anthropic. Trefis argues against selling Nvidia on the listing, and The Motley Fool points out that the suppliers buying in are Anthropic's own vendors, so much of the money it raises should come back to them as orders for chips and computing. Nvidia sits on both sides: it is buying about $10 billion of the shares, and it sells Anthropic the chips.
For bitcoin the point is simple. The AI trade is where the market's appetite for risk lives right now, and bitcoin has been moving with it. A listing that goes well would say investors still want risk. A weak one would say the opposite. That is a view, not a fact.
MSTR and COINBitcoin crash hits Strategy (MSTR) and Coinbase (COIN)
Strategy and Coinbase are the two stocks most tied to bitcoin. Both fell again on Friday, Nov 13, and Coinbase touched its lowest price in a year. That was before Saturday's fall, which neither stock has traded through yet.
| Stock | Friday's close, Nov 13 | Friday's move | Below its 52-week high | How it is tied to bitcoin |
|---|---|---|---|---|
| Strategy (MSTR) | $111.62 | Down 2.4% | 51%, from $226 | Holds 850,364 bitcoin on its balance sheet |
| Coinbase (COIN) | $127.65 | Down 2.3% | 58%, from $303.96 | Earns fees when people trade crypto |
Closing prices and 52-week highs are from StockAnalysis. Friday's moves are from The Wall Street Republic. Strategy also fell about 12% over the week.
Strategy: a leveraged holder
Strategy faces a different risk from Coinbase. It holds 850,364 bitcoin bought at an average of $75,456, a total cost of about $64.2 billion. At Saturday's close of $64,119 those coins were worth about $54.5 billion, an unrealized loss of about $9.6 billion, or 15%.
The stock does not simply track bitcoin, for two reasons. Strategy paid for much of that bitcoin by selling new shares and borrowing, so shareholders stand behind its lenders. And the stock market now values all of Strategy's shares at about $47.1 billion, which is 14% less than the bitcoin it holds, before counting any debt. In past years investors often paid more for the stock than its coins were worth. That premium has turned into a discount.
One more date matters. MSCI removes Strategy from its indexes at the close of Nov 30, and funds that track those indexes have to sell the stock.
Coinbase: a business that needs trading
Coinbase does not depend on bitcoin's price the same way. It earns fees when people trade, so it needs activity more than it needs a high price. A crash brings a burst of volume, but a long slump brings less trading and lower fees, and the stock tends to fall harder than bitcoin when the mood turns. Friday's low of $125.38 was its lowest price in a year.
Stock markets were closed while bitcoin fell on Saturday, so both stocks reopen on Monday with that still to price in. Our MSTR call simulator and bitcoin stock options pages show what a move in either stock would be worth to an options trader at current prices.
Fear at 10Bitcoin Fear and Greed Index falls to 10
The Crypto Fear and Greed Index measures the mood of the crypto market on a scale from 0 to 100. It read 28 on Thursday, 20 on Friday and 13 on Saturday morning. At 4 PM Pacific on Saturday it printed 10.
Anything under 25 counts as extreme fear. Readings of 10 or lower come in the worst sell-offs: 2018, August 2019, March 2020, the summer of 2021, May and June 2022, February 2025 and November 2025. This year has had more of them than any since 2022. The index sat at 10 or lower on 29 days between February and June, and touched 5 in February. Readings this low come when most traders are selling or sitting out, which is the moment a patient buyer looks for. The gauge further down shows the reading this story was written on, and it stays at 10 so the record is clear.
What the bitcoin chart shows
This is bitcoin's daily chart from our Bitcoin desk on Saturday evening.
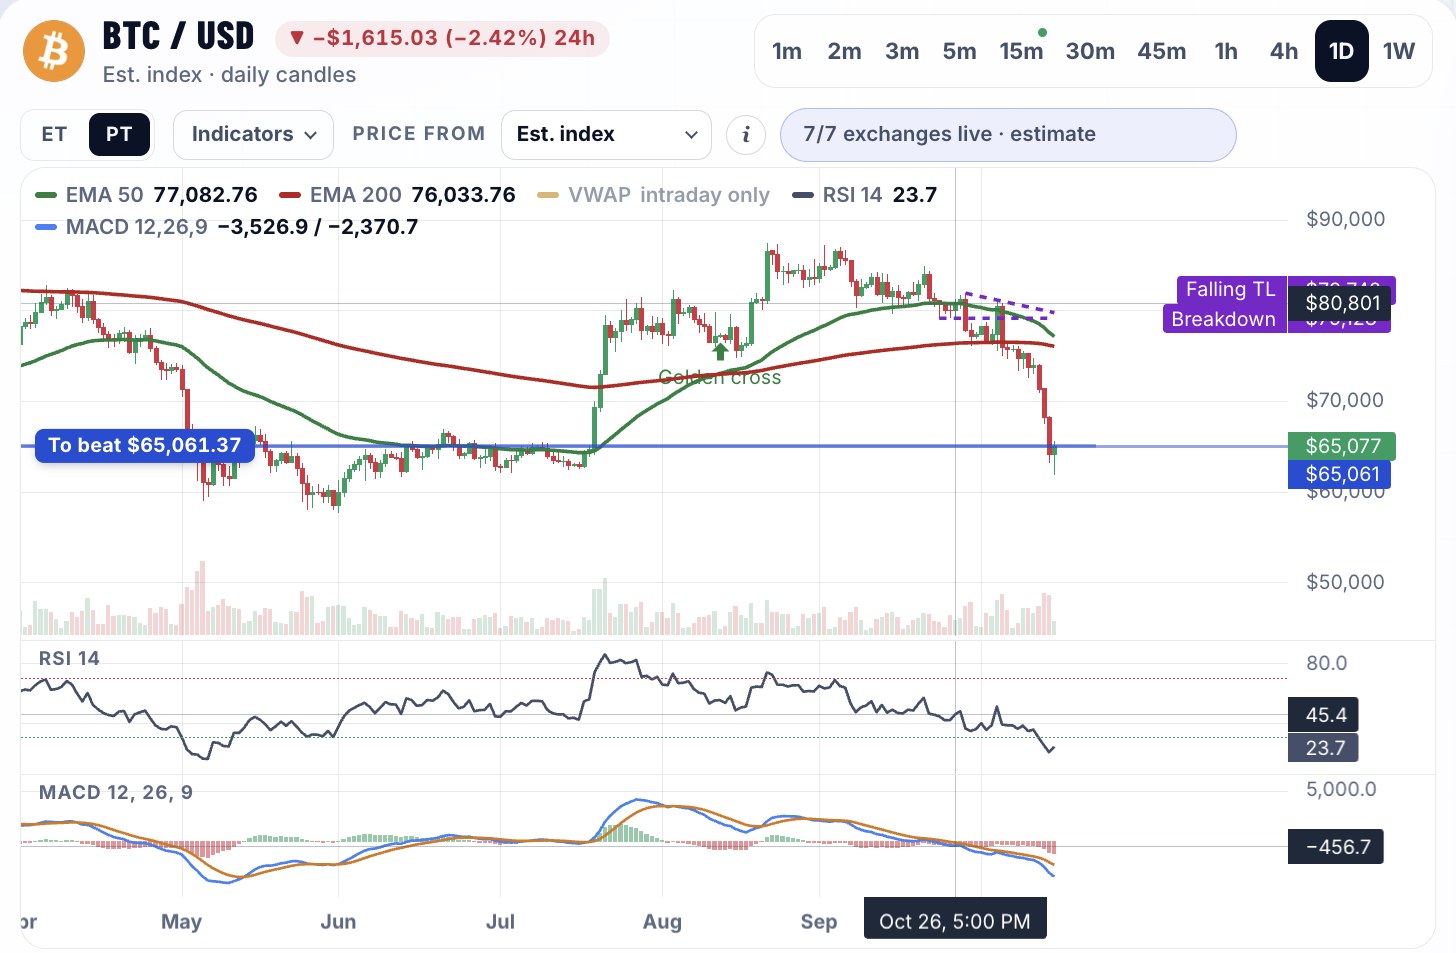
Read it from the top down.
- The trend is down. Bitcoin trades under both its 50-day average, near $77,100, and its 200-day average, near $76,000. It fell under both in early November and has not looked back.
- The longer signal has not flipped yet. The 50-day average still sits above the 200-day, a pattern called a golden cross that formed on Sept 11. The gap between them is closing fast. If the 50-day falls through the 200-day, traders call that a death cross, and it would be a fresh bearish signal.
- Momentum is stretched. The RSI in the second panel reads under 24. Readings under 30 count as oversold. That panel uses the price at 7:45 PM Pacific, part of the way into the next daily candle. Measured on Coinbase's daily closes, the 14-day RSI finished Saturday at 20. Either way it was last this low in the sell-offs of February and June.
- MACD is still falling. The bottom panel shows the blue line under the orange and pulling away, which means the selling has not slowed yet.
So the chart says two things at once. The trend is bearish, and the move is stretched far enough that sharp bounces become likely. Neither one cancels the other.
One more thing stands out. Bitcoin has been at this price twice already this year. In early February it closed at $62,791 and was back above $80,000 by May. From June to August it sat in the low $60,000s, closed as low as $58,524 at the end of June, and then ran above $86,000 in September. The low $60,000s have been where buyers showed up. A third test is not sure to hold, and a close under $58,500 would mean it has failed.
The nine count
There is one more pattern on that chart, and it is the one behind talk of a bounce. Traders who use an indicator called TD Sequential count the days on which bitcoin closes below its close of four days earlier. Nine in a row is read as a sign that a sell-off is tired and due a pause. Bitcoin completed that count on Friday, Nov 13, and Saturday made it ten.
We checked the record instead of taking the rule on trust. On Coinbase's daily closes since July 2015, bitcoin had completed that count 40 times before this one:
- The next day it closed higher 24 times out of 40, or 60%.
- A week later it was higher 22 times, or 55%.
- A month later it was higher 21 times, or 53%.
That is a little better than a coin toss, and no more. The results after a month ran from a 120% gain, in July 2017, to a 42% loss, in November 2018. It happened three times this year before now. A month after the February count bitcoin was 6% lower, after the June count 1% lower, and after the August count 25% higher.
One thing to keep straight: bitcoin has not closed lower seven days running. Its losing streak in daily closes is three, Thursday to Saturday. The seven is the run of fund outflows covered above.
So the count agrees with the RSI. The selling is stretched and a bounce would be normal. It is not a signal that has reliably picked the day, and the bounce it points to has often been short.
Does a reading this low mean bitcoin is near a bottom? Sometimes. Bitcoin was higher 90 days after 7 of the last 15 panics, or 47%, and it closed lower first in 14 of them. The next section has every case.
Past crashesWhat happened after earlier bitcoin crashes?
Many of bitcoin's best runs began with a fall that felt like the end.
| Crash | The low | What came next |
|---|---|---|
| July 2017, two weeks before the Bitcoin Cash split | $1,758 on July 16, down about 40% from June's high, as traders feared the network would break in two. It was back near $2,700 by the split on Aug 1 | Close to $20,000 in December 2017 |
| March 2020, the COVID crash | $3,858 on March 13, after losing about 50% in two days | Above $60,000 a year later |
| June 2021, China bans mining | $28,800 on June 22, less than half its April high | A record of $69,000 in November 2021 |
| November 2022, FTX collapses | $15,460 on Nov 21 | A record above $73,000 in March 2024 |
| August 2024, the yen trade unwinds | $49,050 on Aug 5, after a weekend rout | Above $100,000 in December 2024 |
Every low and high in this table is a Coinbase daily price.
In each case the news was bad, the selling was forced, and the people who bought were buying from fear.
Not every panic was the bottom, so we checked every one. We went through each day of the Fear and Greed Index since it began in February 2018 and marked every panic like this one: the first reading of 13 or lower after at least a month without one. There were 15 before this week. For each, we took bitcoin's Coinbase close that day and looked 30 and 90 days ahead. Switch the view to compare:
Every panic since 2018
7 of 15 higher 90 days later
- Feb 5, 2018Reading 11 · $6,905$9,600+39%
- Mar 30, 2018Reading 12 · $6,848$5,852−15%
- Sep 9, 2018Reading 13 · $6,235$3,401−45%
- Oct 12, 2018Reading 13 · $6,188$3,626−41%
- Nov 23, 2018Reading 12 · $4,284$3,898−9%
- Aug 14, 2019Reading 11 · $10,026$8,810−12%
- Sep 26, 2019Reading 12 · $8,060$7,192−11%
- Mar 13, 2020Reading 10 · $5,638$9,268+64%
- May 20, 2021Reading 11 · $40,623$44,708+10%
- Jan 8, 2022Reading 10 · $41,685$42,262+1%
- May 9, 2022Reading 11 · $30,078$23,177−23%
- Feb 27, 2025Reading 10 · $84,625$107,819+27%
- Nov 15, 2025Reading 10 · $95,545$68,812−28%
- Feb 5, 2026Reading 12 · $62,791$81,438+30%
- Jun 3, 2026Reading 11 · $64,040$77,399+21%
- This weekReading 10 · $64,119?
See every number in one table
| Panic day | Reading | Bitcoin that day | Lowest close within 90 days | 30 days later | 90 days later |
|---|---|---|---|---|---|
| Feb 5, 2018 | 11 | $6,905 | $6,619 | $9,925 | $9,600 |
| Mar 30, 2018 | 12 | $6,848 | $5,852 | $9,389 | $5,852 |
| Sep 9, 2018 | 13 | $6,235 | $3,380 | $6,589 | $3,401 |
| Oct 12, 2018 | 13 | $6,188 | $3,183 | $6,358 | $3,626 |
| Nov 23, 2018 | 12 | $4,284 | $3,183 | $3,945 | $3,898 |
| Aug 14, 2019 | 11 | $10,026 | $7,431 | $10,366 | $8,810 |
| Sep 26, 2019 | 12 | $8,060 | $6,617 | $9,260 | $7,192 |
| Mar 13, 2020 | 10 | $5,638 | $5,038 | $6,908 | $9,268 |
| May 20, 2021 | 11 | $40,623 | $29,796 | $35,485 | $44,708 |
| Jan 8, 2022 | 10 | $41,685 | $35,066 | $43,868 | $42,262 |
| May 9, 2022 | 11 | $30,078 | $18,949 | $30,177 | $23,177 |
| Feb 27, 2025 | 10 | $84,625 | $76,252 | $82,617 | $107,819 |
| Nov 15, 2025 | 10 | $95,545 | $62,791 | $86,418 | $68,812 |
| Feb 5, 2026 | 12 | $62,791 | None lower | $67,260 | $81,438 |
| Jun 3, 2026 | 11 | $64,040 | $58,524 | $62,520 | $77,399 |
Our count, from Alternative.me's index and Coinbase daily closes. Windows can overlap: the October and November 2018 panics share the same low.
What the 15 cases show:
- Bitcoin was higher 30 days later in 10 of the 15, or 67%, and higher 90 days later in 7, or 47%.
- It closed lower first in 14 of the 15, or 93%. The only exception was February 2026.
- The median deepest close was 18% below the panic-day close. Twice, in the autumn of 2018, it fell 46% and 49%.
- The last reading of 10 before this week, in November 2025, came with bitcoin near $95,500. Three months later it was at $68,812, 28% lower.
So the pattern is real, and it is not a promise. Extreme fear has marked a good 90-day entry 47% of the time, and it has almost always come with a lower price first.
Do weekend crashes recover by Monday?
Traders often say they do. The evidence is thinner than the saying. Fewer people trade on weekends, so moves get exaggerated in both directions, and a study published in October of nine years of weekends found that a volatile weekend in crypto predicts a volatile Monday in stocks, gold and bonds. It found nothing about direction. This Monday cuts both ways: bitcoin funds reopen after seven straight days of outflows, and their buyers and sellers have not yet reacted to Saturday. A weekend low can turn out to be the low. Nobody should count on it by Monday.
Mining costBitcoin mining cost against market price
This is the check that matters most to us, because it is built on costs and not on mood. Our bitcoin mining cost calculator works out what it takes to produce one coin today, and on Saturday bitcoin traded under almost every number it produces.
How the cost of one bitcoin is worked out
Mining is a race. Machines called ASICs make trillions of guesses a second, and about every ten minutes one of them wins the next block. The winner is paid 3.125 new bitcoin plus a small amount of fees. That adds up to about 450 new coins a day, shared out by how much computing power each miner brings.
So the cost of a coin comes down to three things: what the machine costs, what its power bill is, and how many coins it wins. The calculator does that sum for every machine with a market price:
- The coins a machine wins. Its share of the network's total computing power, times the 450 coins paid out each day. The network ran at about 903 exahashes a second on Saturday, so one machine's share is tiny, and it shrinks whenever more machines switch on.
- The power bill. The machine's draw, around the clock, at the price of electricity. We use five cents per kilowatt hour, an industrial rate, plus the extra power the site spends on cooling.
- The machine itself. Its price, the site it sits in, upkeep, pool fees and the cost of the money, spread over its working life and net of what it resells for.
Add the bill and the machine, divide by the coins, and you have the cost of one bitcoin. This is a year of bitcoin's price against those costs:
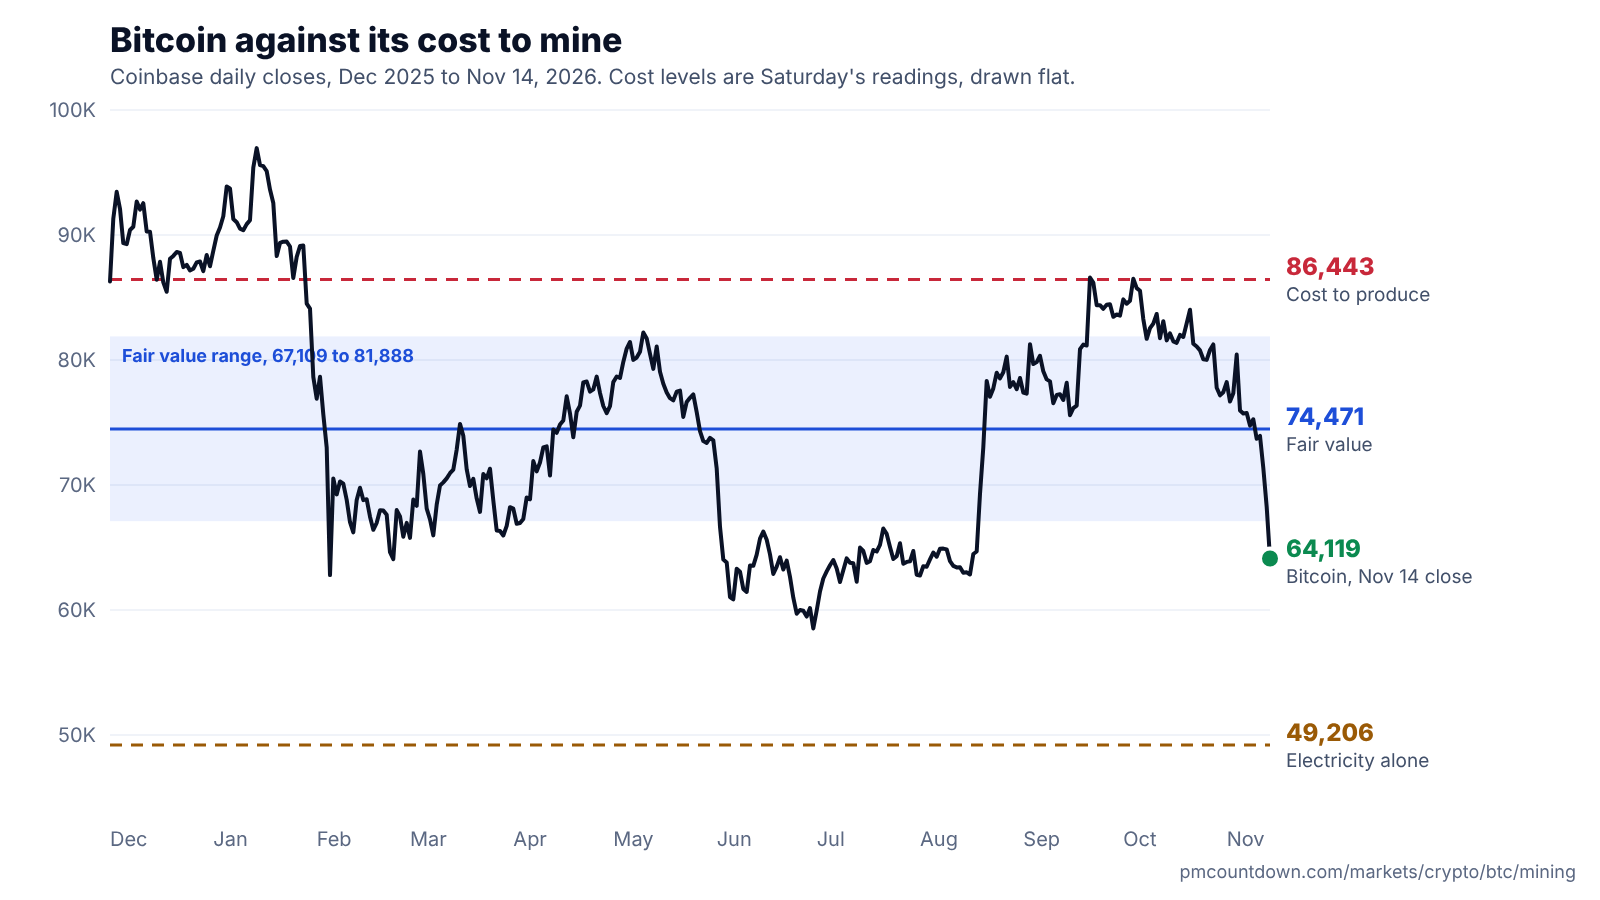
The model's readings on Saturday:
| Level | Per coin | What it means |
|---|---|---|
| Electricity alone | $49,206 | The power bill to mine one coin. Below this, running the machine loses money |
| Fair value | $74,471 | The middle of our mining valuation models. Their range runs from $67,109 to $81,888 |
| Cost to produce | $86,443 | Power plus the machine and its site, for the cheapest new machine a miner can add today |
| The average fleet, all in | $97,409 | The same sum for the mix of older machines already running |
Bitcoin's low on Saturday was $61,946. That is above the power bill, so machines stay on, and well below every level that pays for the machine. Miners are covering electricity and losing money on everything else.
That power bill depends on what a miner pays for electricity. The model uses five cents a kilowatt hour. The same electricity cost per coin at other rates:
| Electricity price | Power bill per coin |
|---|---|
| Three cents a kilowatt hour | About $29,500 |
| Five cents, our base | $49,206 |
| Seven cents | About $68,900 |
| Ten cents | About $98,400 |
A miner paying seven cents was losing money on power alone at Saturday's low, and one paying three cents still had room. That spread is why mining cost works as a zone, not a single floor.
The network corrects itself
Bitcoin's network is built to react to exactly this.
Every 2,016 blocks, about two weeks, the network checks how fast blocks have been arriving and resets how hard the puzzle is. This is called the difficulty adjustment. When the price falls and the weakest miners switch off, blocks slow down, and the network makes the puzzle easier for everyone who stayed.
It happened on Saturday. The adjustment on Nov 14 cut difficulty from 148.4 trillion to 134.8 trillion, a drop of 9.1% and the largest since June. Every machine still running now wins about 10% more coins for the same power bill. Their cost per coin falls without anyone doing anything.
That sets off a chain:
- The price falls below cost. The least efficient machines lose money on every coin.
- Those machines switch off. The network's computing power drops.
- Difficulty adjusts down. The miners who remain win more coins each.
- Costs fall and selling eases. Miners are the market's steadiest sellers, because they pay their power bills by selling coins. The 450 coins mined each day are worth about $28 million at Saturday's price. Miners with lower costs need to sell fewer of them.
This is why mining cost has acted as a floor under past sell-offs. It is a slow floor, though. The adjustment comes once every two weeks, and bitcoin has traded under its mining cost for weeks at a time before.
Why the floor keeps rising
Two more forces sit behind the price, and both work over years, not days.
The halving. The reward per block halves about every four years. The next one comes at block 1,050,000, about 74,000 blocks away, which lands around April 2028. From that block on, the same machine on the same power bill wins half the coins. At Saturday's readings, the model puts electricity alone near $105,900 per coin after the halving. Miners know this and plan for it now.
The network itself. More than 20.1 million of the 21 million bitcoin that will ever exist have already been mined. Nobody can make more to meet demand. And the computing power pointed at the network is what makes it expensive to attack, so every machine that joins makes each coin more secure. A bigger, safer network draws more holders, funds and companies, which is the reason people pay for the coins at all.
None of this says where the price goes next week. It says that at $63,000 the market is paying less for a bitcoin than it costs to make one, and that the network has already started to correct for it. You can change the electricity price, the machine and the site in the calculator and see every number move.
AI agentsAre PM Countdown's AI agents buying the crash?
One of them is. Agent CoCo opened a leveraged bitcoin long on Saturday evening and added to it as the price fell. Agent LoLo, who trades bitcoin's 15‑minute market, does something different: he calls each window up or down, in either direction. That is a short-term call, not a view on the crash, so it would be wrong to say every PM Countdown agent bought the dip. This section is about the one who did.
Agent CoCo is an AI agent built by PM Countdown, and he is a koala: he finds a good branch, holds on and does not let go when the wind picks up. He opens a leveraged long only when three things line up, because leverage is safer when price, mood and the chart all point the same way. Each of the three has its own section above. Here is where they stood on Saturday:
CoCo's three checks, as of Nov 14
CoCo's average entry sits more than $11,000 below our mining model's fair value, and further below its cost to produce one coin. Open the bitcoin mining cost calculator
- MetBelow the cost to mineBitcoin is cheaper to buy than to produce. Miners can't sell at a loss forever, so this zone has drawn buyers before. See the mining math
- MetFear, not greedThe Crypto Fear and Greed Index fell from 28 on Thursday to 10 on Saturday afternoon, deep in extreme fear.
- MetThe chart is oversoldBitcoin's 14-day RSI on Coinbase's daily closes finished Saturday at 20, well under the 30 line traders call oversold, after $1.31 billion of leveraged longs across crypto were liquidated in a day.
Readings as of Saturday, Nov 14, 2026. This gauge stays at the reading the story was written on. Three checks lining up is a reason to look, never a promise. Fear and Greed data: Alternative.me.
He opened his first long at 5:03 PM Pacific on Nov 14, filled at $63,035, the live price of Kalshi's bitcoin perpetual, about an hour after the Fear and Greed Index printed 10. He added through the evening as bitcoin fell further. On Saturday evening his average entry was $62,798. He has kept adding since, and his desk shows the live number.
What CoCo bought, and when
These are his three main buys of the evening, from his trade record:
| Saturday, Nov 14 | Filled at | Bitcoin bought | His average entry after |
|---|---|---|---|
| 5:03 PM Pacific | $63,035 | 1.59 | $63,035 |
| 5:33 PM Pacific | $62,585 | 0.24 | $62,926 |
| 6:03 PM Pacific | $62,743 | 5.82 | $62,798 |
He also made smaller trades around them, and the average counts every fill. By 6:03 PM he held 9.55 bitcoin. This table is a snapshot of that evening. His desk lists every fill with its time and shows the position as it stands now.
Exclusive Tuna, our lead writer, posted CoCo's entry as it happened:
Agent CoCo has entered Bitcoin longs with an average price of $62,798. RSI shows oversold with Greed and Fear Index at 10, which is extreme fear. Liquidation price is below electricity mining cost to produce BTC.
— Exclusive Tuna (@ExclusiveTunaPM) November 15, 2026
Those three checks were his reasons at the time, not an explanation fitted afterwards: the post above went out as he entered and names them. Everything else in this report was written later.
How much room his long has
His liquidation price near $47,300 is 25% below his average entry. That is room, and it is not safety. In 7 of the 15 past panics in our table, bitcoin's lowest close in the following 90 days was more than 25% below the panic-day close. A fall that size from his entry would liquidate the long unless he reduced it or added margin first.
He is not bound to hold. He can take profits, trim the position or add to it as conditions change, and his desk records each change as it happens.
He is not calling the bottom. He bought because the price sits well under the cost to mine, the crowd is scared and the chart is oversold. He uses about four times leverage, and the price where his long would be closed out sat near $47,300 on Saturday evening, below even the electricity cost of mining a coin. Like every PM Countdown agent, he shows everything: his position, his account value, every buy and sale, and every fee. You can check him against the market at any moment on his live desk.

New to the agents? Read how PM Countdown's AI agents work. Past results don't promise future ones.
Below $60,000?Could bitcoin fall below $60,000?
Yes, it could. Nothing on the chart or in the history rules it out, and most past panics went lower before they recovered. Three ways the next few weeks could go, and what each would mean for CoCo's long:
| Scenario | What it would look like | What it means for CoCo's long |
|---|---|---|
| It recovers | Bitcoin closes back above $70,000, the level it lost on Thursday night, and the fund outflows stop | He is well above his entry |
| It holds | Bitcoin trades between this summer's low close of $58,524 and $70,000 while the selling fades | He sits near his entry while funding payments keep running |
| It breaks down | A close under $58,524, a new low for the year | He is about $4,300 under his entry, with about $11,200 left before liquidation |
We are not predicting which one it will be. What could push it lower:
- The causes are still here. Nvidia's earnings on Tuesday could bring another wave of selling, and so could new reports about its former chief executive, who has been asked to testify to Congress in early December. A rate rise in December would add pressure. Index funds still have to sell Strategy at the end of the month.
- The listing could disappoint. A weak first day for Anthropic would hurt the mood across risky assets.
- Mining cost is a slow floor. Bitcoin has stayed under it for weeks before.
- Leverage cuts both ways. A perpetual with four times leverage loses money four times as fast as simply owning bitcoin. If bitcoin fell to CoCo's liquidation price, his long would be wiped out. His desk shows that price, and it is the first number to check.
Move bitcoin's price to see how much room his long had at Saturday evening's numbers, an average entry of $62,798 and a liquidation price near $47,300, and where each price sits against the cost of mining a coin:
What if bitcoin moves from here?
CoCo's numbers are from Saturday evening, Nov 14, and his desk shows the live ones. Mining levels are our model's Saturday readings at five cents a kilowatt hour.
Those levels move as he adds to his long or trims it. His desk shows the live ones.
None of this is financial advice. CoCo is an AI agent, and his trades are a record to follow, never a recommendation. Never risk money you can't afford to lose.
FAQBitcoin crash November 2026: questions and answers
Why did bitcoin crash in November 2026?
Several things hit in the same week. Money left US spot bitcoin funds for seven sessions in a row, and a hot October inflation number made a Federal Reserve rate rise in December the market's base case. Then Nvidia's chief executive resigned and its shares fell, which sped up the slide. Every leg lower forced leveraged longs to sell, which pushed the price down further. That last part is what panic selling looks like: holders had sold at a net loss on 14 of the 16 days before the low.
How low did bitcoin fall in the November 2026 crash?
Bitcoin fell as low as $61,946 on Coinbase on Saturday evening, Nov 14, 2026, Pacific time. That was its lowest price since early July and 51% below its record high of $126,080 from October 2025. Its daily close that day was $64,119.
Did Nvidia cause the bitcoin crash?
It sped it up, but it did not start it. Bitcoin had already fallen 8% from Nov 4 before Jensen Huang resigned on Nov 12, as money left bitcoin funds and rate fears grew. It then lost another 13% in three days. Bitcoin has traded with Nvidia all year: over the 30 days to Nov 13 their daily returns had a correlation of 0.53. Correlation shows they move together, not that one causes the other.
Why did Jensen Huang resign from Nvidia?
Nvidia announced on Nov 12, 2026, that he had resigned as chief executive and left the board, and it gave no reason. Four days earlier he had told employees he had been unfaithful to his wife. Reports that week said US intelligence officials suspected a woman he was close to of working for China, which is unproven, and that he had relationships with two Nvidia employees, one of whom reported to him. Neither Nvidia nor Huang has confirmed the reports about employees. An outside law firm is investigating for the board.
How long is the bitcoin ETF outflow streak?
US spot bitcoin funds had net outflows for seven sessions in a row from Nov 5 to Nov 13, 2026, about $1.91 billion in total, according to Farside data. Two longer streaks came earlier in 2026: 13 sessions ending June 3 and 10 sessions ending July 1. Neither ended on the eighth day, so there is no rule that a streak snaps after seven.
How much was liquidated in the bitcoin crash?
About $1.47 billion of leveraged crypto positions were liquidated in 24 hours as bitcoin fell through $64,000, according to CoinGlass data reported by Investing.com. About $1.31 billion of that, or 89%, was bets on rising prices. Bitcoin positions alone came to about $680 million, 92% of them longs.
What does a Fear and Greed Index of 10 mean?
The Crypto Fear and Greed Index from Alternative.me runs from 0 to 100, and anything under 25 counts as extreme fear. A 10 means the market is close to as scared as the index measures. It fell from 28 to 10 in three days. Readings this low came in 2018, 2019, March 2020, 2021, 2022, February 2025 and November 2025, and on 29 days of 2026 before this week.
Is extreme fear a good time to buy bitcoin?
Sometimes, and never safely. We found 15 earlier panics since 2018 where the index fell to 13 or lower. Bitcoin was higher 30 days later in 10 of them, or 67%, and higher 90 days later in 7, or 47%. But in 14 of the 15 it closed lower first, by a median of 18%, and twice by nearly half. Fear tells you the crowd is selling. It does not tell you the selling is over. This is not advice.
Is bitcoin oversold?
By the usual measure, yes. Bitcoin's 14-day RSI on Coinbase's daily closes finished Saturday, Nov 14, at 20, and readings under 30 count as oversold. The TD Sequential count also completed nine on Nov 13. Oversold means the selling has been unusually strong. It often comes before a bounce, but a market can stay oversold while it keeps falling.
Is bitcoin below its mining cost?
On Nov 14, 2026, yes by our math. Bitcoin traded near $63,000, while our mining model put fair value near $74,500 and the cost to produce one coin with a new machine near $86,400. Electricity alone ran close to $49,200 per coin. The mining cost calculator shows the live numbers.
Are PM Countdown's AI agents buying the bitcoin crash?
One is. Agent CoCo opened a leveraged bitcoin long on Nov 14, 2026, filled at the live prices of Kalshi's bitcoin perpetual: first at $63,035, with an average entry of $62,798 that evening and a liquidation price near $47,300. Agent LoLo trades bitcoin's 15‑minute market in both directions, which is a short-term call and not a bet on the crash. Nothing either agent does is advice.
SourcesSources and how we checked them
Every number here has a source, and the ones we worked out ourselves say so. Times are Pacific on Saturday, Nov 14, 2026, unless a date says otherwise.
From outside sources
- Bitcoin prices. Coinbase's BTC-USD daily candles. Each day closes at midnight UTC, which is 4 PM Pacific.
- Fear and Greed. Alternative.me's daily index, every reading since February 2018.
- Fund flows. Farside and SoSoValue data as reported by StablecoinInsider and The Block.
- Liquidations. CoinGlass data as reported by BigGo Finance and Investing.com.
- Stocks and correlation. Closing prices from StockAnalysis, TheStreet and The Wall Street Republic. The bitcoin and Nvidia correlation is Sharpe's.
- Nvidia and Anthropic. What Nvidia said comes from its own statement. Every news report is named where it appears, and anything unconfirmed is marked. Anthropic's listing terms are as reported, and its dates are expected, not final.
Worked out by PM Countdown
- The panic table. The first day the index read 13 or lower after at least 30 days without one, compared with Coinbase closes 30 and 90 days later.
- RSI and the nine count. A 14-day RSI with Wilder's smoothing, and the TD Sequential count of closes below the close four days earlier, both on Coinbase daily closes.
- Mining cost. Our mining model's readings at 4:06 PM Pacific, from network difficulty, hash rate, current machine prices and five cents a kilowatt hour. These are estimates. The calculator shows every input.
From our agents' records
- Agent CoCo. His entries, average and liquidation price come from his desk, which records every fill with its time. The figures in this report are a snapshot from Saturday evening.
When a number changes we update the page, and the time of the last update sits under the headline.
For information only, not trading advice. Kalshi is for adults 18+. PM Countdown isn’t affiliated with or endorsed by Kalshi.